Turning Chaos into Calculated Gains
Stock Price Portfolio Optimization
Crafting the perfect stock portfolio is an art of balance—maximizing returns while keeping risks at bay, all guided by historical trends and financial metrics. It involves weaving diversity through price movements, predicting returns and volatilities, and linking the threads of correlations among various equities. The ultimate goal? Unearthing a collection of investments with the highest Sharpe ratio—a beacon of optimal risk-reward balance, offering a clear strategy to turn your financial aspirations into reality.
Skills: Python (pandas, numpy, matplotlib, seaborn)

Gathered insights from leading 2025 contenders—NVIDIA, Unilever, Procter & Gamble, and SAP—by analyzing their stock market data.
The visual story unfolds through a graph, tracing their close prices from January 2024 to January 2025. Unilever takes the spotlight with a higher close price, while the rest showcase a steadier rhythm, marked by milder fluctuations.
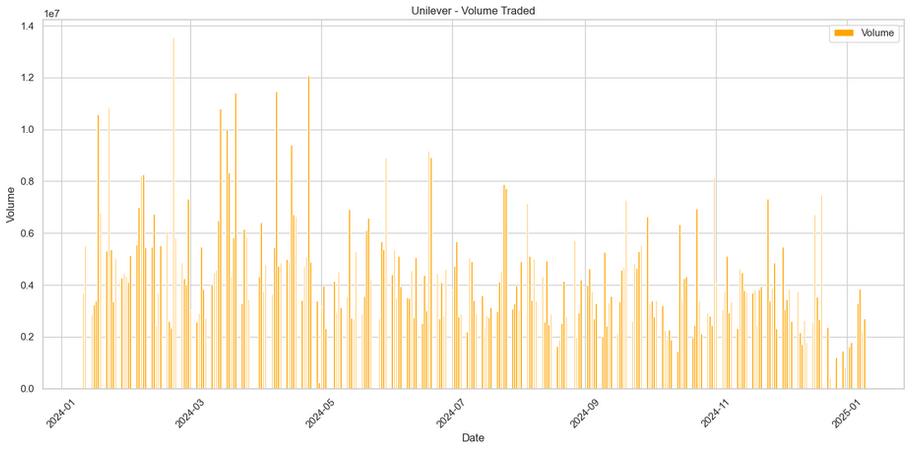
By analyzing the 50-day and 200-day moving averages, the visuals reveal close price trends for each stock. Remarkably, all stocks show a steady upward trajectory in their close prices. The volume traded graphs add another dimension, spotlighting intense trading activity at key moments, with notable spikes during Q1 2024 signaling periods of heightened market interest.

The daily return distributions paint a near-normal picture, centered around zero—most daily returns hover close to the average.
The tails stretching on either side reveal moments of notable gains or losses. Interestingly, Unilever and P&G showcase slightly broader distributions, hinting at greater volatility compared to their steadier counterparts.
Leveraging Modern Portfolio Theory, an efficient portfolio was crafted by harmonizing risk and return.
NVIDIA emerges as the frontrunner, boasting the highest expected return (109%) coupled with moderate volatility (52%), making it a high-risk, high-reward contender. SAP follows closely with a strong expected return (52%) and lower volatility (23%). On the other hand, P&G, with its low expected return (11%) and minimal volatility (15%), appears less appealing when considering risk-adjusted returns.

Each dot on the chart tells a story, with its color revealing the Sharpe ratio—a benchmark for risk-adjusted returns.
Portfolios perched on the leftmost edge of the efficient frontier, hugging the Y-axis, deliver the highest expected returns for a fixed level of volatility, representing the epitome of optimization. The gradient paints a clear picture: darker blue portfolios, with higher Sharpe ratios, are the champions of risk-adjusted performance.
The portfolio with the maximum Sharpe ratio stands out with these stellar features:
Expected Return ~ 43%
Volatility ~ 12%
Sharpe Ratio ~ 3.39%
The final result is a well-diversified portfolio with the following allocation:
NVIDIA (13%)
Unilever (47%)
SAP (26%)
P&G (12%)
Unilever takes the lead with the highest allocation, underscoring its substantial influence on the portfolio's performance. Interestingly, NVIDIA, despite its highest expected return, holds the smallest allocation, reflecting a balanced approach to manage risk and reward effectively.
Disclaimer:
This project is for educational and informational purposes only. The analysis and portfolio allocations presented herein are based on historical data, market trends, and theoretical models, and should not be construed as financial advice or recommendations for any specific investment strategy. Investing in the stock market involves significant risk, including the potential loss of capital. Past performance is not indicative of future results. Users are encouraged to conduct their own research and consult with a qualified financial advisor before making any investment decisions.


